

I recently resigned from my company. Before I submit my resignation email, I made a kubernetes environment end-to-end with the help of AI. I literally have so much fun with it. Claude gives very precise guide and information about the requirements I need. It gives information about what specification of my kubernetes environment needs, and made the command lines to be run on the servers.
The kubernetes is on premise, so we have full control of the environment.
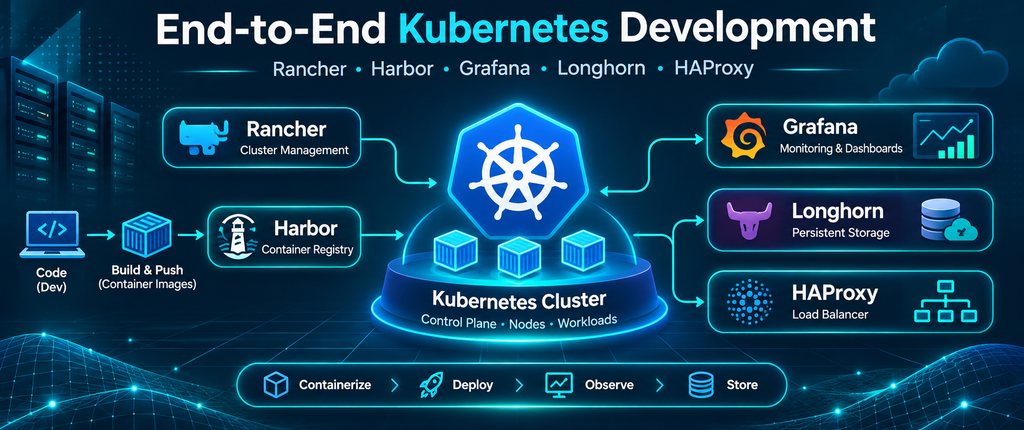
What Are The Components?
Kubernetes composed by so many components of apps. Here are the lists of the application I used for my kubernetes.
| Purpose | Apps | Setup Needed? |
|---|---|---|
| Server OS | Ubuntu | Minimal, only apt update && apt upgrade and several utility libraries |
| Kubernetes UI | Rancher | Only 1 Rancher needed for many clusters |
| Kubernetes Engine | RKE2/K3s | Need to setup once for all nodes |
| LoadBalancer | HAProxy | Setup once for each clusters |
| Volume Storage | Longhorn | Setup with Rancher |
| Image Repository | Harbor | Setup on VM, connect via IP or domain |
| Databases | PostgreSQL/MySQL/Clickhouse | Setup on VM, connect via IP |
| Monitoring | Grafana | Setup once at each cluster |
| Logging | Prometheus & Loki | Setup at each nodes |
| Language or Frameworks | PHP & Laravel | You can use any framework you want |
Why Use Those Apps?
The guide was quite straightforward. Those apps was the first recommended apps by Claude. So basically we choose what apps was best for each component.

Rancher is a UI-based Kubernetes Management System. We can perform project deployment, scaling, and container resource management through Rancher. It can be used either by UI or YAML format. There are also app extension we can use with Rancher such as Grafana, Prometheus, and Loki for additional metric monitoring, and Longhorn for volume storage.

Harbor is used for image repository for container images. Works with docker CLI and desktop, we only need to input credentials and path domain.

HAProxy used as a loadbalancer for incoming and outgoing network for each nodes in a cluster. It displays sophisticated network data, but we only needed for the loadbalancing purposes. We uses loadbalancing metric on another platform.

Longhorn as a volume storage can be maintained with Rancher. It have an app extension which we can manage (add, delete, or restore) volume by UI.

Grafana is a powerful monitoring tool. It only needed data source from metrics like Prometheus or Loki, then query it within the Grafana to display great dashboard.

Clickhouse is a notable mention. It is a good and optimized database for storing big data and doing complex computation.
This is an exceptionally well-articulated discussion on “Example of Kubernetes Environment I Made For My…”. Appreciate the dedication to detailed analysis here. Keep up the great work!